


0
Dollar Index
On Tuesday, the dollar rebounded only slightly in early trading, failing to recover much of the previous trading day's heavy losses. The initiative in the negotiations is in China's hands, and the United States will not unilaterally make concessions. This is another confusing signal about the progress of trade negotiations in recent days. Although there is a lack of substantive progress in the current trade negotiations, both sides seem to have softened their positions in recent days. The United States has expressed its willingness to partially reduce tariffs, while Asian countries have exempted some American products from 125% tariffs. This week, the market is also paying attention to the intensive release of US economic data, which will serve as an early signal to assess the actual impact of Trump's trade policy. In particular, Friday's non-farm payrolls report, the preliminary data on first-quarter economic growth, and the core PCE inflation data preferred by the Federal Reserve have attracted much attention from the market.
From the daily trend, the US dollar index is currently fluctuating around 99 after a series of declines, and the overall situation is still weak. The short-term 5-day {99.22} and 10-day {99.38} moving averages continue to decline, and the rebound is limited to 99.84 {weekly high} and 100.00 {market psychological barrier} areas; indicating that the medium-term trend is also gradually weakening. The 14-day relative strength index (RSI) of technical indicators is currently around 37, close to the oversold area. Although there is a technical rebound demand in the short term, the strength is limited; the green column of the MACD indicator continues to expand, and the fast and slow lines continue to decline, reflecting that the short-term momentum is still dominant. The key support level below is 98.90{low point at the beginning of the week} and 99.00{integer mark}. Once it is lost, it will open up further downward space to 97.91{previous low point}. The initial resistance level above is 99.84{high point at the beginning of the week} and 100.00{market psychological mark}. Breaking through points to 100.70{low point on April 10} and 100.82{20-day simple moving average}.
Today, consider shorting the US dollar index around 99.30, stop loss: 99.45, target: 98.80, 98.90

WTI spot crude oil
On Thursday (March 27), international oil prices rose slightly as market participants were evaluating the impact of tightening global crude oil supply and the latest US tariffs on the global economy and energy demand.
WTI crude oil futures fell more than 2% to below $61 a barrel, a two-week low, extending the previous trading day's 1.5% drop, as global trade tensions and weak US economic data dampened demand prospects. Crude oil is facing its biggest monthly drop since 2021, falling 15% in April, amid concerns that President Trump's escalating tariffs could push the global economy into recession. A decline in US consumer confidence has exacerbated signs of economic pressure. Meanwhile, OPEC+ may accelerate planned production increases at its May 5 meeting, with Saudi Arabia and other countries expected to increase supply. Kazakhstan's crude oil exports increased by 7% year-on-year to 1.63 million barrels per day, helped by increased flows from the Caspian Sea pipeline. In addition, expectations for Iranian crude oil to return to the market have re-emerged as nuclear negotiations have made progress and Russia announced a temporary ceasefire in the war in Ukraine, which will begin on May 8.
From the daily level, WTI crude oil has fallen from around $65 and has now fallen below the important support level of $62, with an overall bearish trend. In the short term, the 5-day {62.10} and 10-day {62.32} moving averages form a "death cross" bearish pattern and continue to suppress oil prices downward. The 20-day moving average {62.78} turns downward, and a medium-term weak pattern emerges. In terms of technical indicators, the 14-day relative strength index (RSI) is near 40, which is in a weak area, but has not entered an extremely oversold state, indicating that oil prices still have further room to fall; the green column kinetic energy of the MACD indicator continues to increase, and the two lines are in a downward divergent state, which strengthens the bearish dominance. At present, the important support level below WTI is looking at the $60 mark. If it falls below, it will further open up the downward space to around $58.50, while the initial pressure level above is at $62.50 and 62.78 {20-day moving average}. Overall, WTI is weak in the short term, and the rebound is limited. If there is no major positive stimulus, oil prices are likely to continue to fluctuate and fall.
Today, you can consider going long on crude oil around 59.70, stop loss: 59.50; target: 61.00; 61.20

Spot gold
On Tuesday, gold prices fell below $3,320 an ounce as easing trade war concerns suppressed demand for safe-haven assets. Treasury Secretary Scott Bessant said on Monday that many major U.S. trading partners have made "very good" tariff proposals, adding that China's recent decision to exempt some U.S. goods from retaliatory tariffs shows its willingness to ease tensions. Bessant pointed out that the government is in contact with China from all sides, but stressed that China needs to take measures to reduce tensions. Reports also suggest that President Trump will soon announce measures to reduce the impact of his auto tariffs. Attention now turns to key U.S. economic reports later this week, including the first-quarter GDP estimate, March PCE inflation data, and April nonfarm payrolls data, which will provide fresh insights into the health of the economy and the Fed's policy outlook.
Gold's weakness below the $3,300-$3,290 area represents the 38.2% Fibonacci retracement level of the latest rise from the mid-$2,956 near the monthly low of $3,500 at $3,292.50, and may continue to find considerable support around the $3,265-$3,260 level. A clear break below the latter would be seen as a new trigger for bearish traders and pave the way for an extension of the recent correction from the all-time highs hit last week. The subsequent decline could drag gold prices to the 50% Fibonacci retracement level, around the $3,228.40 area. On the other hand, the $3,353 {early week high} area now appears to be an immediate obstacle. Following closely is the supply zone of $3,366-3,368, which if broken effectively, will allow gold prices to recapture the $3,400 mark. Momentum could extend further to the psychological $3,500 mark.
Consider going long on gold before 3,312 today, stop loss: 3,308; target: 3,335; 3,340

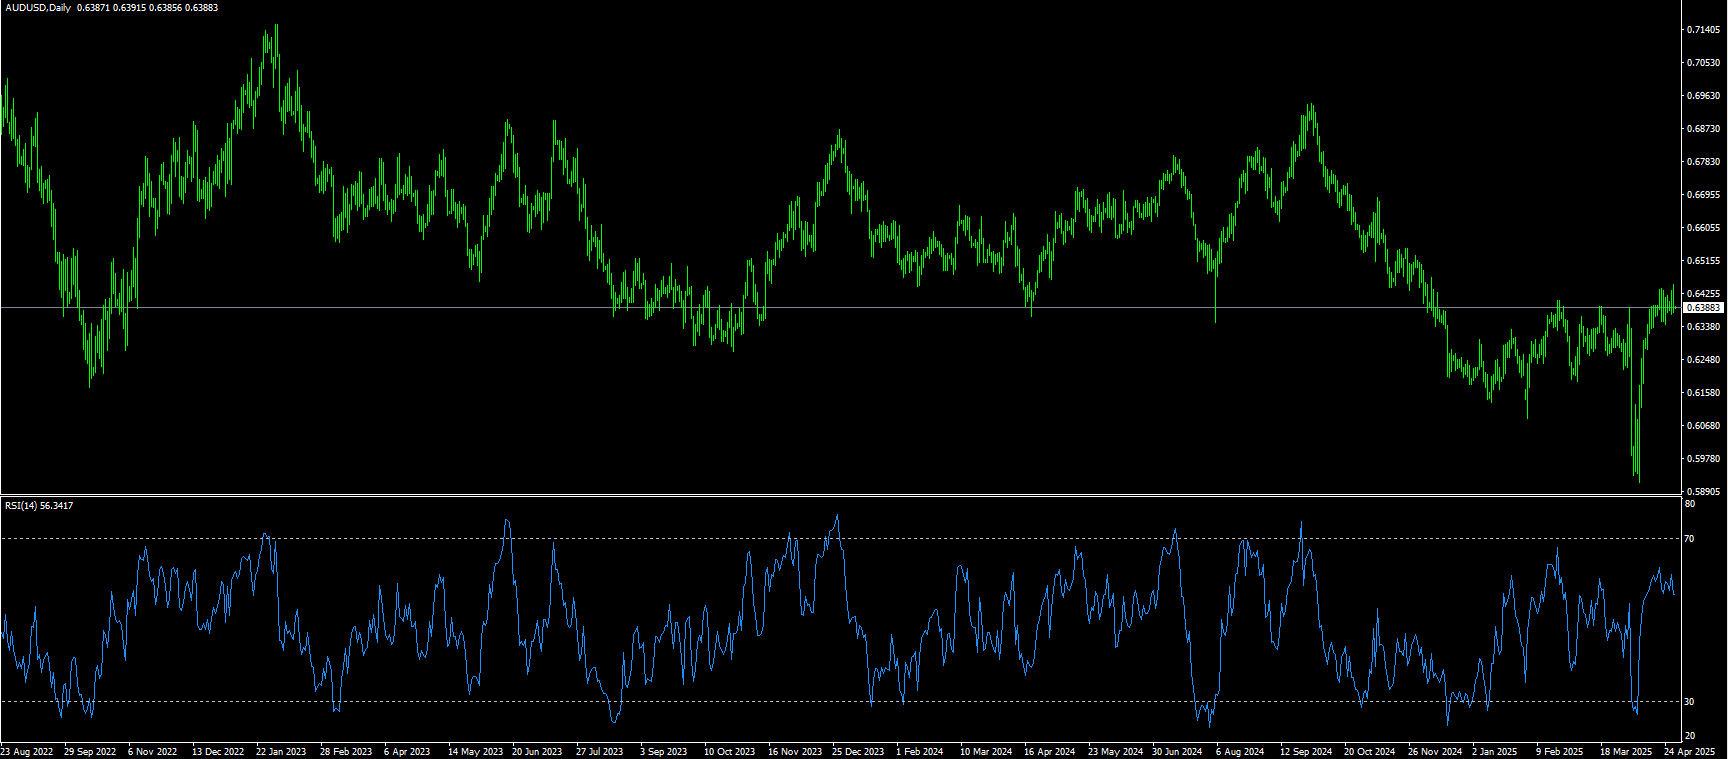
AUD/USD
The Australian dollar edged lower on Tuesday after rising more than 0.50% against the US dollar in the previous session. Chinese Foreign Minister Wang Yi said on Tuesday that making concessions and backing down would only embolden bullies, stressing that dialogue is key to resolving differences. However, a spokesperson for the Chinese Embassy in the United States on Friday firmly denied any current negotiations with the United States, saying "there are no consultations or negotiations between China and the United States on tariffs." Traders will now turn their attention to the upcoming Australian inflation report on Wednesday, which could affect market expectations for Reserve Bank of Australia policy. The Reserve Bank of Australia is widely expected to implement another 25 basis point rate cut in May to counter the potential impact of the newly imposed US tariffs.
AUD/USD traded at 0.6420 on Tuesday before retreating to around 0.6385. The daily chart shows a bullish bias. The pair remains above the 9-day simple moving average of 0.6396, while the 14-day relative strength index (RSI) is well above 55, indicating sustained upward momentum. On the upside, the recent four-month high of 0.6439 is a clear resistance, recorded on April 22. The next level is 0.6462 {200-day moving average}. A break above this level could open the door for a rebound towards the five-month high of 0.6515. Initial support is around 0.6365, the 14-day simple moving average. A sustained break below these levels would weaken the bullish outlook and could trigger deeper losses, bringing the psychological 0.6300 level into focus.
Today's recommendation is to go long AUD before 0.6372, stop loss: 0.6360, target: 0.6420, 0.6430
GBP/USD
On Tuesday, GBP/USD attracted some selling around 1.3400, pressured by a small rebound in the US dollar. Investors awaited a speech from Bank of England official Dave Ramsden for fresh impetus. The US dollar strengthened against the pound as concerns about trade tensions eased. US Agriculture Secretary Brooke Rawlings said on Sunday that the Trump administration is in dialogue with China on tariffs every day. Rawlings further said that negotiations between the two countries are still ongoing and trade deals with other countries are "very close". On the pound front, firm expectations that the Bank of England will cut interest rates by 25 basis points to 4.25% at its May meeting continue to put pressure on the pound. Investors will be watching closely the speech of Bank of England official Dave Ramsden later on Tuesday. Any dovish comments could weaken the pound in the short term.
The daily chart shows that the pound has shown a strong upward trend against the dollar after the previous adjustment. The exchange rate is currently standing above the 1.3355{5-day moving average} support level, which also corresponds to the convergence area of multiple moving averages. It is worth noting that since the low of 1.2099, the exchange rate has formed a complete upward trend, hitting a recent high of 1.3445, an increase of more than 11%. The 14-day RSI indicator of the technical indicator currently reads above 60, which is in a higher area but has not yet reached an extremely overbought state, which means that the exchange rate may have room to rise in the short term. The exchange rate is currently above 1.3400{integer mark}, and it seems to be accumulating energy to break through the 1.3445 resistance level. Then challenge 1.3500. Conversely, if the pair falls below the 1.3400 mark, the next support level will be 1.3355 {5-day moving average}, followed by 1.3300 {market psychological level}.
Today's recommendation is to go long GBP before 1.3388, stop loss: 1.3375, target: 1.3440, 1.3450

USD/JPY
The Japanese yen edged lower during the Asian session on Tuesday, paring some of the gains from the previous day's strong rebound from a two-week low against its US rival. The overall market sentiment remained cautiously optimistic due to signs of easing trade tensions between the two largest economies, the United States and China, and expectations that the United States will start announcing some trade deals. This in turn was seen as weakening traditional safe-haven assets including the yen, although traders seemed reluctant to make aggressive directional bets ahead of the Bank of Japan's policy meeting this week. Moreover, ongoing geopolitical tensions and US President Trump's rapidly changing stance on trade policy kept investors on their toes, which could limit the yen's losses. Moreover, the underlying bearish sentiment surrounding the US dollar should help limit any substantial gains in USD/JPY.
From the daily chart, USD/JPY has formed a clear downward channel, but has recently tested the upper track of the channel, showing signs of strengthening short-term rebound momentum. The RSI indicator is currently at 39.80, showing a weak state. Although the MACD indicator is still below the zero axis, the red column has increased, indicating that the downward momentum may weaken. From the price structure, USD/JPY has formed a reversal pattern after hitting the low of 139.88, and is now close to the psychological level of 142.00. If USD/JPY can effectively break through the 143.90 {early low of the week} and 144.00 {integer level} area, it may further challenge the resistance level of 144.70 (21-day moving average). In the long run, the slowdown in the normalization of the Bank of Japan's policy will also put pressure on the yen. However, as global economic growth slows, other major central banks including the Federal Reserve may further cut interest rates, which will continue to narrow the yield gap with Japan and support the strength of the yen in the long run. Recent support is at 141.60 and 140.50 levels, and a break below the latter could start a new downtrend.
Today, it is recommended to short the dollar before 142.48, stop loss: 142.70; target: 141.50, 141.30

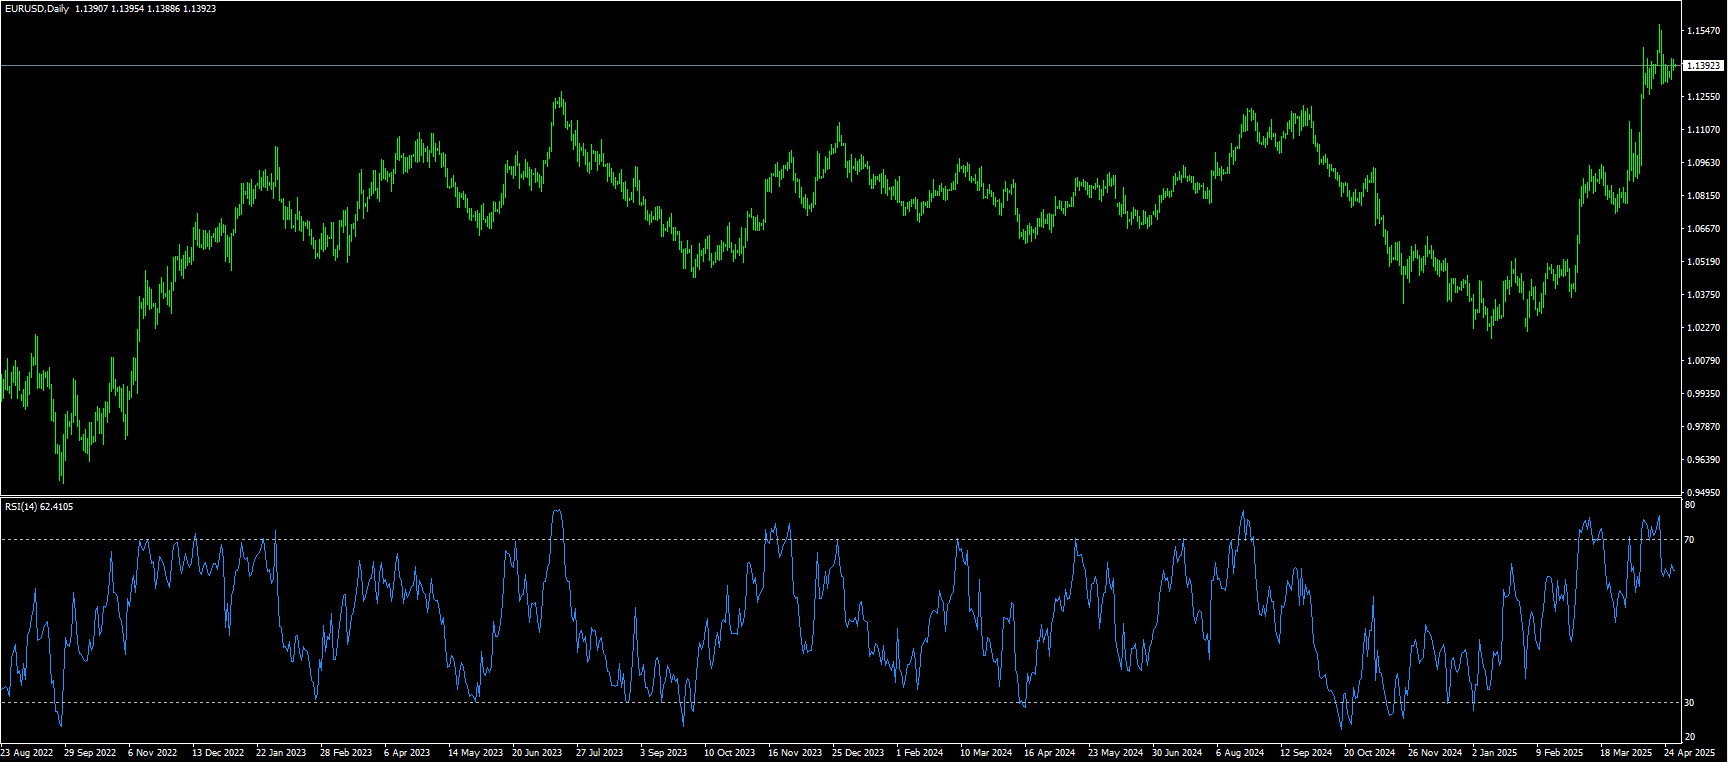
EUR/USD
On Tuesday, EUR/USD slipped to below close to 1.1400. The euro weakened against the dollar as bets on further rate cuts by the European Central Bank in June rose. Investors are bracing for further developments in U.S. trade policy before the closely watched U.S. non-farm payrolls data to be released on Friday. Bessant said on Monday that the U.S. government is in touch with China, but the first step in de-escalating the tariff fight with the United States lies with Beijing due to the trade imbalance between the two countries. Investors will keep a close eye on U.S.-China relations. Trump's chaotic trade policy has undermined confidence in U.S. assets, and the euro has gradually emerged as an alternative destination for investor funds. Any signs of an escalation in the U.S.-China trade war could put pressure on the dollar and provide support for the EUR/USD pair. ECB policymakers are increasingly confident of cutting interest rates in June as inflation continues to ease. ECB policymaker Olli Rehn said on Monday that the central bank may cut interest rates below the neutral level that keeps the economy balanced.
EUR/USD maintained its positive tone with a slight rise. Technical indicators on the daily chart show a mixed but overall constructive bias. The 14-day relative strength index (RSI) remains above 60 and the moving average convergence/divergence (MACD) gives a sell signal, but the overall technical pattern remains tilted to the upside. Momentum indicators and key moving averages continue to support the bullish view, while immediate support and resistance levels define a good range for near-term action. While bullish and bearish power indicators remain flat. However, the main bullish conviction stems from the 1.1400 psychological mark, while the first upside target appears at 1.1500 {round number mark}. If the rise continues, it may see a rise to 1.1547, the high of April 22. Immediate support is at 1.1315, the low of April 24, and around 1.1300 (round mark). If it continues to trade below the above levels, it may fall to 1.1264 (low of April 15).
Today, it is recommended to go long on the euro before 1.1375, stop loss: 1.1360 target: 1.1420, 1.1430.
Disclaimer: The information contained herein (1) is proprietary to BCR and/or its content providers; (2) may not be copied or distributed; (3) is not warranted to be accurate, complete or timely; and, (4) does not constitute advice or a recommendation by BCR or its content providers in respect of the investment in financial instruments. Neither BCR or its content providers are responsible for any damages or losses arising from any use of this information. Past performance is no guarantee of future results.
Lebih Liputan


Pendedahan Risiko:Instrumen derivatif diniagakan di luar bursa dengan margin, yang bermakna ia membawa tahap risiko yang tinggi dan terdapat kemungkinan anda boleh kehilangan seluruh pelaburan anda. Produk-produk ini tidak sesuai untuk semua pelabur. Pastikan anda memahami sepenuhnya risiko dan pertimbangkan dengan teliti keadaan kewangan dan pengalaman dagangan anda sebelum berdagang. Cari nasihat kewangan bebas jika perlu sebelum membuka akaun dengan BCR.

 English
 简体中文
简体中文
 繁體中文
繁體中文
 Bahasa
Melayu
Bahasa
Melayu
 Tiếng
Việt
Tiếng
Việt
 ไทย
ไทย
 日本語
日本語
 한국어
한국어
 ភាសាខ្មែរ
 español